Insert Query Data into Excel
Insert Data
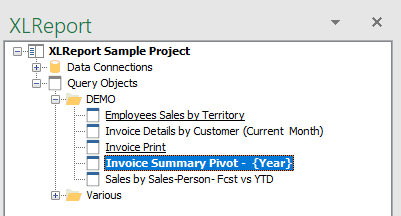
Select the XLReport Query object from within the Project Explorer and insert its underlying data as:
Static Sheet
This inserts the raw static data into Excel.
Live – Real Time Sheet
This inserts a live real time connected data set into Excel.
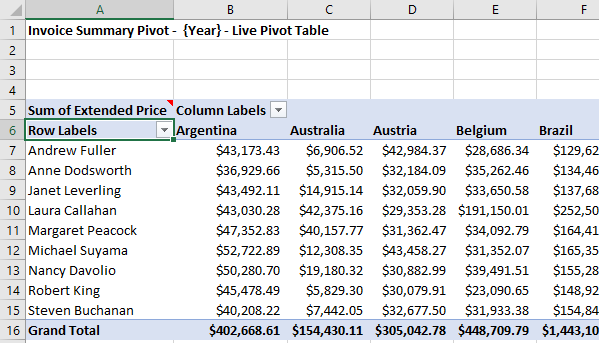
Live – Real Time Pivot Table
This inserts a live real time connected data set into Excel.
Optionally, you can choose to also insert a live real time connected Pivot Chart.
Insert as Static Data
- Select the Query Object in the Project Explorer and double click it.
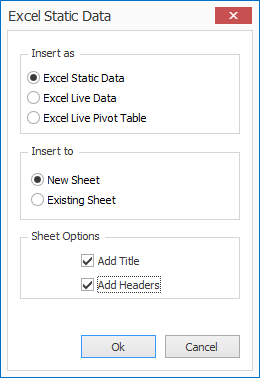
- Select “Excel Static Data”.
- Select if to place the data in a new Excel sheet or a designated range.
- Choose if to add a title – the XLReport Query Object’s name – above the data.
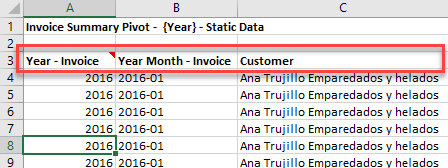
- Choose if to add column headers – the XLReport Query – column headers – above the data.
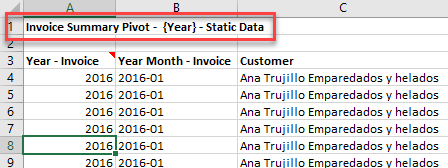
If you select “New Sheet” then XLReport will insert a new Excel sheet and assign the name of the Query Object to it (max. 20 characters).
The data from the underlying Query Object will be inserted into Excel.
Insert as Real Time Data
- Select the Query Object in the Project Explorer and double click it.
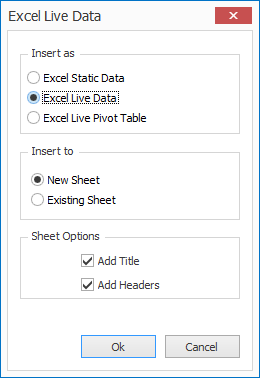
- Select “Excel Live Data”.
- Select if to place the data in a new Excel sheet or a designated range.
- Choose if to add a title – the XLReport Query Object’s name – above the data.
- Choose if to add column headers – the XLReport Query – column headers – above the data.
- Select if to place the data in a new Excel sheet or a designated range.
If you select “New Sheet” then XLReport will insert a new Excel sheet and assign the name of the Query Object to it (max. 20 characters).
If you select “Existing Sheet” then you must assign either a cell or point the mouse to an Excel cell.
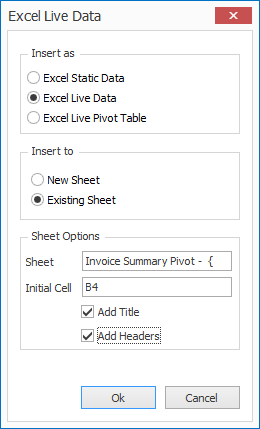
The data from the underlying Query Object will be inserted into Excel.
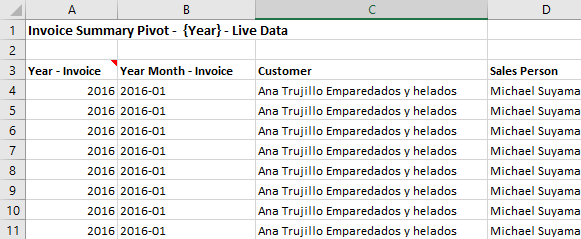
Important! If you convert – format – your data set to an Excel table, then the live data connection will be lost and the data set will be converted as static data.
Insert as Real Time Pivot
- Select the Query Object in the Project Explorer and double click it.
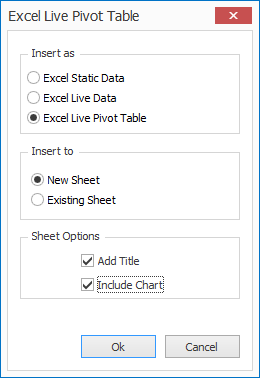
- Select “Excel Pivot Table”.
- Select if to place the data in a new Excel sheet or a designated range.
- Choose if to add a title – the XLReport Query Object’s name – above the data.
- Choose if to add column headers – the XLReport Query – column headers – above the data.
- Select if to place the data in a new Excel sheet or a designated range.
- If you select “New Sheet” then XLReport will insert a new Excel sheet and assign the name of the Query Object to it (max. 20 characters).
- If you select “Existing Sheet” then you must assign either a cell or point the mouse to an Excel cell.
- Optionally select “Include Chart” to insert also a Pivot Chart.
The data from the underlying Query Object will be inserted into Excel.
- If you select to also insert a Pivot Chart, XLReport creates a new sheet with it.
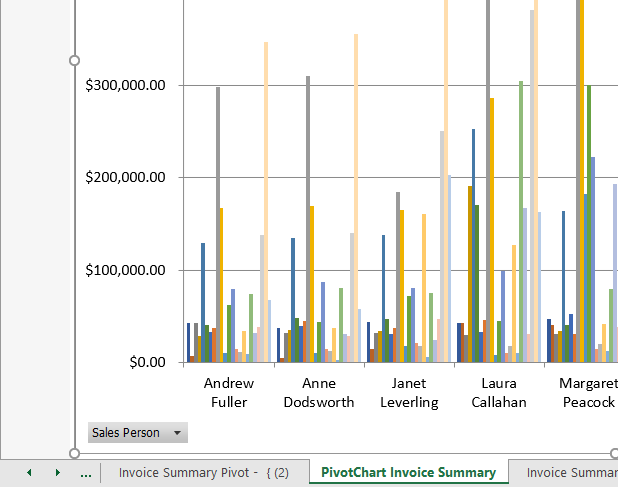
Note: The Pivot Chart will be bound to the Pivot Table.
That means: whenever you change pivot settings to either the table or the chart the table / chart will also be updated to the same parameters.
Parameters
When a parameter Query data is inserted into Excel it will show a comment above the data which displays the parameter values. Hover over the comment to view its text.